Create a chart by code
When adding a Chart tag from the Custom Tags menu, it is possible to reference a previously created Chart object. For more information on chart tag properties refer to Working with tags.
The value of the tag should be a reference to a previously created Chart object already having the series and categories defined. Categories are usually seen as the x variable in the graph, with series being the value that is plotted against the x value.
The application exposes ChartCategory and ChartSeries classes and the Chart object has a collection of both.
Objects
Chart
Constructors
The Chart class exposes the default constructor only
Properties
The Chart class exposes 3 public properties
- IList<IChartCategory> Categories: List of categories for the chart
- IList<IChartSeries> Series: List of series for the chart
- Title: The title of the chart
Methods
The Chart class exposes 1 public method
- UpdateChart
ChartCategory
Constructors
The ChartCategory class exposes 2 constructors
- ChartCategory(string name)
- ChartCategory(string name, AxisType axis)
Properties
The ChartCategory class exposes 2 public properties
- string Name: The category name
- AxisType Axis: The axis type of the category
- Title: The title of the chart
Methods
The ChartCategory class doesn't expose methods
ChartSeries
Constructors
The ChartSeries class exposes 2 constructors
- ChartSeries(string name, IEnumerable<double?> values)
- ChartSeries(string name, IEnumerable<double?> values, AxisType axis)
Properties
The ChartSeries class exposes 2 public properties
- string Name: The series name
- IEnumerable<double?> Values: List of values of the series
-
AxisType Axis: The axis type of the series
Methods
The ChartSeries class doesn't expose methods
Code Sample
The below code is creating a chart with 4 categories and 2 series.
var chart = new Chart(); |
Common errors
An error occurred while executing this template. The number of values in all the series must be the same as the number categories (4).
This error means that the number of values in one of the series is not equal to the number of categories. The number between parenthesis is the expected number of values per series.
The type or namespace name 'List<>' could not be found (are you missing a using directive or an assembly reference?)
The template is missing the System.Collections.Generic namespace.
An error occurred while executing this template. The series with name 'XXX' already exists.
The series name needs to be unique in a chart.
Chart layout
Layout of the chart is controlled through standard Word chart functionality. Below are a couple tips.
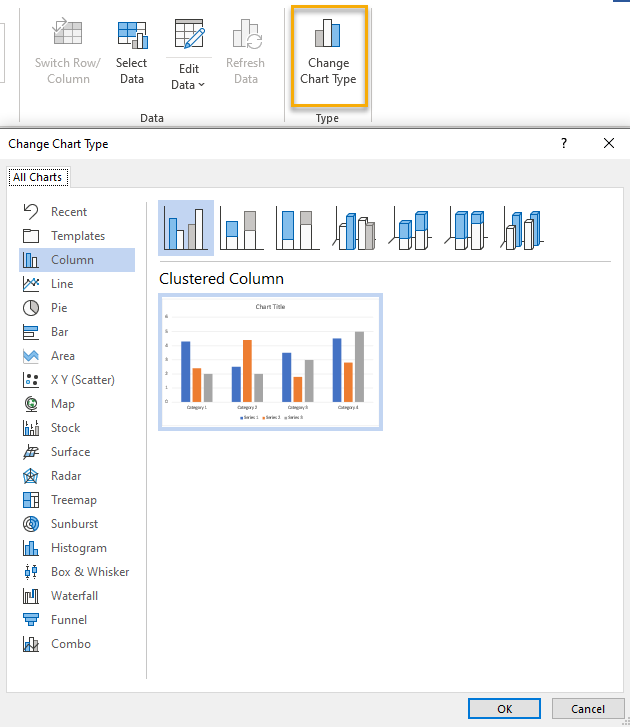
Change Chart Type
By default, the charts are added as Column charts. To change the chart type, select the chart in the document area and use the Change Chart Type button from the Chart Design ribbon.
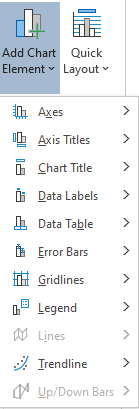
Add Chart elements
By default, the charts are not added with all elements. To add or remove different elements, select the chart in the document area and use the Add Chart Element button from the Chart Design ribbon.
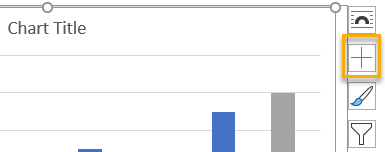
Alternatively, you can use this button on the right of the chart.
Add a series to your chart to configure its properties
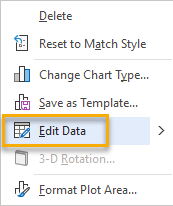
By default, the charts are added with three series. To add a series to your chart, right-click in the chart and select Edit Data.
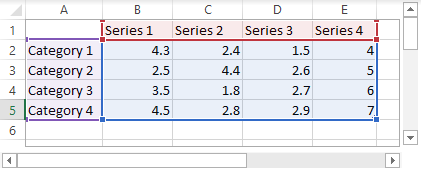
This will open a window in which you'll see a column per series. You'll need to manually type a series name and values (shown in column E). Then, you need to select the bottom right corner of the rectangle and move it one column to the right.
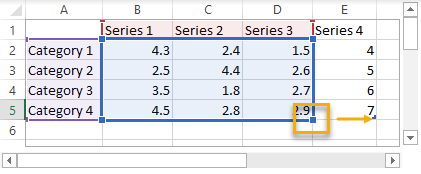
The rectangle needs to include all values as shown below.
Delete a series from your chart
To delete a series from your chart, simply click on the series in the chart and use the Delete button of your keyboard.
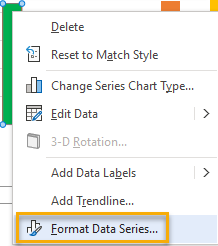
Format a series
To format a series, right-click on a specific series and select Format Data Series...